Guide to using the Blackboard Grade Centre
- Gerard Ross
Introduction
The Grade Centre in Blackboard Learn is more than just a table to record students' grades. It is a dynamic and interactive tool, allowing you to record data, calculate grades and monitor student progress.
In the Grade Centre, you can manage individual student grades for assignments, tests, discussion posts, journals, blogs, and wikis. You can also create grade columns for any activities or requirements you want to grade, such as lab tests and field trip activities.
Table of contents
Accessing the Grade Centre
Access to the Grade Centre is via the Control Panel. You can skip go directly to those items that Needs Marking, Assignments, Tests or simply open up the Full Grade Centre.
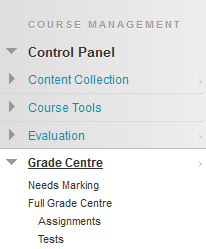
*Important*
Grading for Discussion, Blogs, Journal and Wikis is done via the tool itself. When setting up a new tool you must make it gradeable before it will become available in the Full Grade Centre. Once created, you can then customise smartviews for each of the columns in the Full Grade Centre.
Grade Centre views and entering grades
- The Grade Centre’s default view is the Interactive View. In the interactive view, grades can be typed directly into the table cell for each grade. Use your keyboard’s cursor keys or the Tab key to navigate between cells, and press the Enter key to submit a grade.
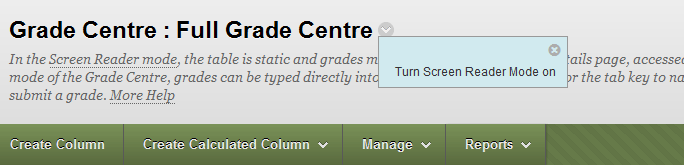
- However, to make the Grade Centre as accessible as possible, it also has Screen Reader View – In screen reader view, the grade table is static and cannot be edited directly. To enter a grade, users must click the table cell and select View Grade Details from the drop-down menu. This view is enabled by selecting the drop down menu beside Grade Centre: Full Grade Centre and selecting Turn Screen Reader Mode On or Turn Screen Reader Mode Off.
Note
Once enabled, Screen Reader View only lasts as long as the current session. When you end your session, Grade Centre will revert back to Interactive View.
In both views, you can do the following:
- Move the cursor from column to column using your keyboard's tab key.
- Navigate cells within the Grade Centre by using the up, down, left, and right cursor keys on a standard keyboard.
Grade Centre Action Bar
Above the main Grade Centre table is the Grade Section Action Bar. The Action bar contains buttons and dropdown menus that allow you to create columns and calculated columns, manage/reorgansie the gradebook, create reports and work offline.
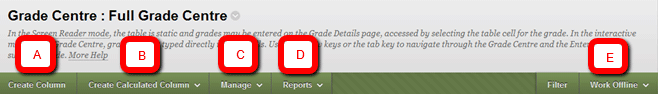
- A - Create Column
This allows you to create your own column, perhaps for an assignment outside of Blackboard, eg in a Laboratory setting or class discussion etc
- B - Create Calculated Column
This allows you to create calculated columns, such as weighted, total or average.
- C - Manage
This allows you to reorganise the Grade Centre, create categories and smart views as well as grading schemas
- D - Reports
This allows you to create reports and view grade history.
- E - Work Offline
This allows you to download Grade Centre results to excel to work offline.
Tip
The columns Last Name and First Name are permanently frozen (denoted by grey background colour) to assist orientation when searching for student results.
Grade Information Bar
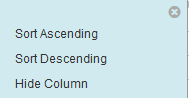
All column titles along the Grade Information Bar can be sorted in ascending or descending order (double chevron beside title). All columns with the exception of Last Name can be hidden.
Tip:
The Last Access column is the last time a student accessed this course only. This could be a very useful tool for an Instructor who is processing an Early Leaver.
Grade Icons
Select the Icon Legend box at any time to list the grade icons. 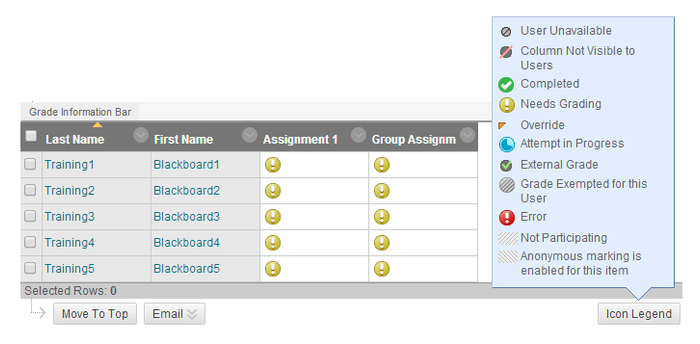
| Icon | Description |
|---|---|
| User unavailable. User unavailable; early leavers, leave of absence (LOA) and withdrawn students. |
| Column not visible to users. Hidden to students but visible to Instructors. |
| Completed. Completed assignment, assessment completed. |
| Needs grading. Submissions have been received and require grading. |
| Override. The auto or manual grade has been manually overridden by the Instructor. |
| Attempt in progress. A student may have saved a draft of an assignment or is currently in an active test. |
| The default total column is the default external grade column, and the external grade icon appears in the |
| Grade Exempted for this user. User Grade not calculated in a student's overall grade. |
| Error. Perhaps a manual grade exceeds the maximum set grade. |
| Non participating. A student in a group who is not participating in a group project. |
| Anonymous marking has been enabled for this item. |


Creating Grading Period
Defining Grading Periods and associating Grade Centre columns to a Grading Period allows Instructors to effectively organize and report on Grade Centre data. Instructors can filter the Grade Centre by Grading Period to display only the columns in the segment. For example, an Instructor may configure the Grade Centre to display the 1st semester columns.Grading Periods are user created segments that can help manage the Grade Centre. Grading Periods, for example, can be defined as semesters, and can have date ranges that further define them. Grading Periods are not created by default. This could be a useful tool especially in relation to very large cohort of students to minimise searching.
- Login to Blackboard.
- Make sure your Edit mode is "ON".
- In the Control Panel select Grade Centre.
- Select the Full Grade Centre link to open the Grade Centre window.
- Select Marking Periods from the Manage box on the Grade Centre Action Bar
- Select the Range button and insert an appropriate start and end date.
- Selcted the check box for Associates column that have a due date within that range to the Grading Period.
- Select Submit to execute.
Creating Categories
A Grade Center Category is a classification of Grade Center Columns. Categories are used to organize and view Grade Center data and can be used when creating Calculated Columns to perform operations on all Grade Columns in a Category. The Grade Center has nine default Categories: Assignment, Blog, Discussion, Journal, SafeAssignment, Self and Peer, Survey, and Test that cannot be removed or edited.
Categories can be created to organise the Grade Centre and run reports on specific types of grades. It is best practice to Create categories before creating Grade Centre items. Default categories include Assignment, Discussion, Survey and Test. This is a useful way your Grade Centre area tidy, eg if you have a series of tests such as Lab1, Lab2, Lab3 etc, it would appropriate to set up a category called Laboratory Tests.
- Login to Blackboard.
- Make sure Edit mode is ON.
- In the Control Panel select Grade Centre.
- Select the Full Grade Centre link to open the Grade Centre window.
- From the Grade Centre action bar Select the Manage drop down menu, and then click Categories.
- On the Categories page that loads select the Create Category button.
- In the Name box, type a name for the category.
- In the Description text area, type a description for the category if you wish. This description will appear on your Categories page.
- When you are finished, click Submit.
Creating a Column
Grade Columns represent any Student effort that is measured. Columns are added to the Grade Center automatically for work done on the system in Discussion Boards, Assignments, and Tests and Surveys. Work done that is not automatically graded can be measured in the Grade Center by creating a Grade Column. You could use this feature to input marks for off-line activities such as attendance or lab tests. Students can access their marks online and Instructors can monitor attendance for tutorials or seminars etc.
- Login to Blackboard.
- Make sure your Edit mode is "ON".
- Select Full Grade Centre from the Control Panel.
- Select Create Column from the Grade Centre Action Bar.
- The Create Column page appears.
- Enter an appropriate Column name.
- Enter a shorter name in Grade Centre Display Name (appears in column header in Grade Centre).
- Enter a suitable description (clickable for students to view).
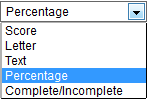
- Enter Primary Display, this what students will see in their My Grades area ie score, letter,
percentage, complete or imcomplete. - Enter Secondary Display this is soley what the Instructor will see, not the student ie you might want them to see a score, however, as an Instructor you might want to see a percentage.
- Select a category from the drop down (see Creating Catorgies above) or leave as no category.
- Enter Points Possible.
- Enter a Due Date (if applicable).
- Select your Option choices, default is YES, YES and NO but you can change them now or later.
- Select Submit to to create a column.
Tip:
Once submitted, the last Column created is appended to the right hand side of the grade center table. You can move a column by selecting the Manage button on the Grade Centre Action Bar and then selecting Column Organization.
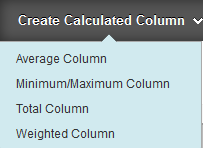
Create a Calculated column
The Create Calculated Column drop-down menu has four options:
- Average - An Average Column calculates and displays the numeric average for a selected number of Columns. Columns with text as the primary display cannot be averaged..
- Minimum/Maximum - A Minimum/Maximum Column calculates either the minimum or maximum grade for a selected number of Columns. Columns with text as the primary display cannot be displayed as a minimum or maximum grade.
- Total - A Total Column calculates the total points for a number of Columns related to the total number of points allowed. Total Columns are useful for generating a final score. Columns with text as the primary display cannot be totalled.
- Weighted - A Weighted Column calculates and displays a grade based for a selected number of Columns based upon each column's respective worth of the total grade. Columns with text as the primary display cannot be displayed as a weighted grade.
To create a Calculated Column:
- Login to Blackboard.
- Make sure your Edit mode is "ON".
- Select Full Grade Centre from the Control Panel.
- Select Create Calculated Column from the Grade Centre Action Bar.
- Select from Average, Minimum/Maximum,Total or Weighted from the drop-down menu. The Create Calculated Columns page will load.
- Enter an appropriate Column name.
- Enter a shorter name in Grade Centre Display Name (appears in as column header in Grade Centre).
- Enter a suitable description. Students are able to view this description.
- Select the Primary Display method from the drop-down menu. This is what students will see in their My Grades area i.e. Score, Letter, Text, Percentage, Complete/Incomplete.
- Select the Secondary Display method from the drop-down menu. This is what the Instructor will see, not the student i.e. None, Score, Letter, Text, Complete/Incomplete

- Select your Columns choices. Choose All Grade Columns to include all grade columns in the average. If Marking Period exists, limit the columns included in the average by choosing All Grade Columns in Marking Period. To include specific columns or categories in the average, choose Selected Columns and Categories.
- Select your Option choices. Select No for the first option to exclude this Grade Centre column from calculations. Select No for the second option to hide this column from Students in My Grades. Select Yes for the third option to show column statistics to Students in My Grades.
- Select Submit to create a calculated column.
Example
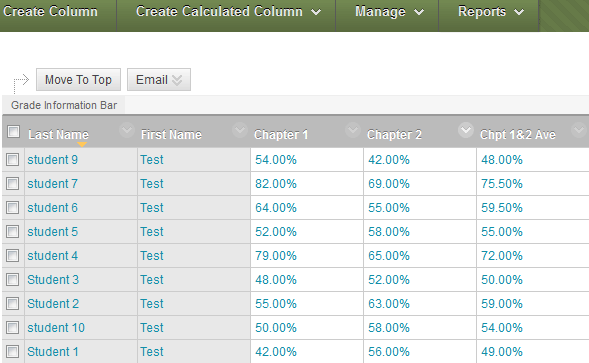
In this example we want to create an average grade based on Chapter 1 and Chapter 2 tests:
Section 3 of Creating Calulated Column, selecting the target columns on which to form average column
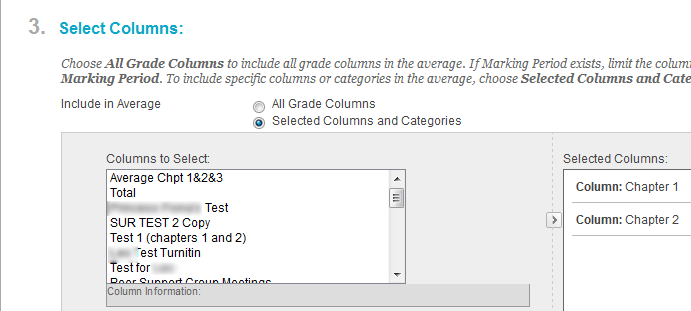
The created column now display an average column based on Chapter 1 and Chapter 2 results.
Create a Smart View
A Smart View is a focused look at the Grade Centre. It shows only the data that matches a set of criteria and/or conditions. Blackboard has already set up two smart views for you, Assignments and Tests. Smart Views allow you to quickly filter a cohort of students.
- Login to Blackboard.
- Make sure your Edit mode is "ON".
- Select Full Grade Centre from the Control Panel.
- On the Grade Centre Action Bar select the Manage button.
- From the drop-down menu select Smart Views. The Smart Views window will open.
- Select the Create Smart View button.
- Insert the name of the Smart View (this name will appear in the Current View drop-down list under Smart Views) and type a description.
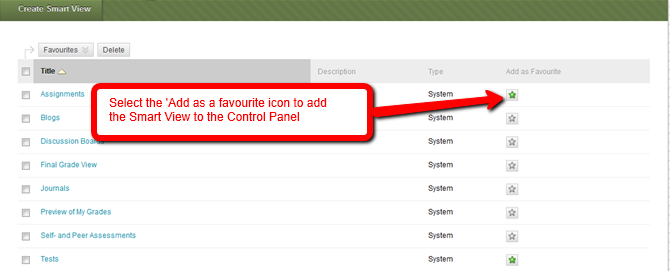
- Select the check box for Add as Favourite to add the Smart View to the Control Panel.
- Select the type of view. The options are: Course Group, Performance, User, Category and Status and Custom. For an explanation of Custom view, please see below.
- Under User Criteria select the grade column.
- Under Condition select the criteria i.e. Equal to or Not Equal to.
- In Value box, select a value, such as a Group Name or type the score or percentage against which the criteria and condition will be assessed.
- Under Users, select All Users from the drop-down list to include results for all students. Select Selected Users from the drop-down list and select the individual students needed. Hold down the CRTL key to select multiple users.
- Under Categories, select a category from the drop-down list, such as Assignment or Test.
- Select the Filter Results from the drop-down list by selecting the columns or grade status, such as Completed or Not Attempted.
- Select Submit to create the Smart View.
When building a Smart View using the Custom Type of View, multiple user criteria can be used. Criteria are added as AND statements. As each criterion is added, it is assigned a number. This number is reflected in the Formula Editor box, which appears below the criteria. Each criterion that is added can have a condition, such as Equal to, Greater than, and Less than. Each condition requires a value to compare with the condition.
After all the criteria have been added, the formula for the query is represented by 1 AND 2 AND 3, and so on. Use the Manually Edit function below the Formula Editor box to edit the formula to change the operators and to insert parentheses to change the way the formula is completed.
Adding a Smart View to the Control Panel
Smart Views can be added to the Control Panel through the use of Favorites.
- Select Smart Views from the Manage box on the Grade Centre Action Bar.
- Select the Smart View you want to add to the Control Panel by selecting the star icon in the Add as Favourite column.
- Select OK.
Filter (and Smart Views)
The Filter box on the Grade Centre Action Bar allows Instructors to create a view of the Grade Centre based on three criteria: Current View (which will include any Smart View created), Category and Status. These can be especially useful when setting and reviewing grades for different types of assessments (e.g. tests, discussions, blogs etc.) and filtering by status (e.g. needs grading, completed, not attempted) 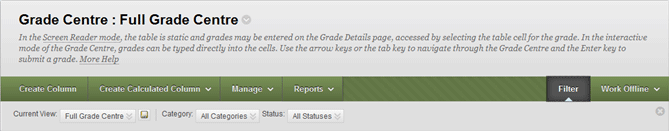
Tip
When you have created the view you want, you can then set it as your default view by selecting the Select Current View as Default button next to the Current View drop down menu ![]()
Additional Grade Centre Information
- Blackboard's own On Demand Learning Center in its section entitled 'Assessing Learning' has a series of video tutorials dedicated to the Grade Centre: Blackboard On Demand
- You may also find our page on Guide to using the Blackboard Grade Centre and Guide to using the Blackboard Grade Centre useful.